
WATER QUALITY
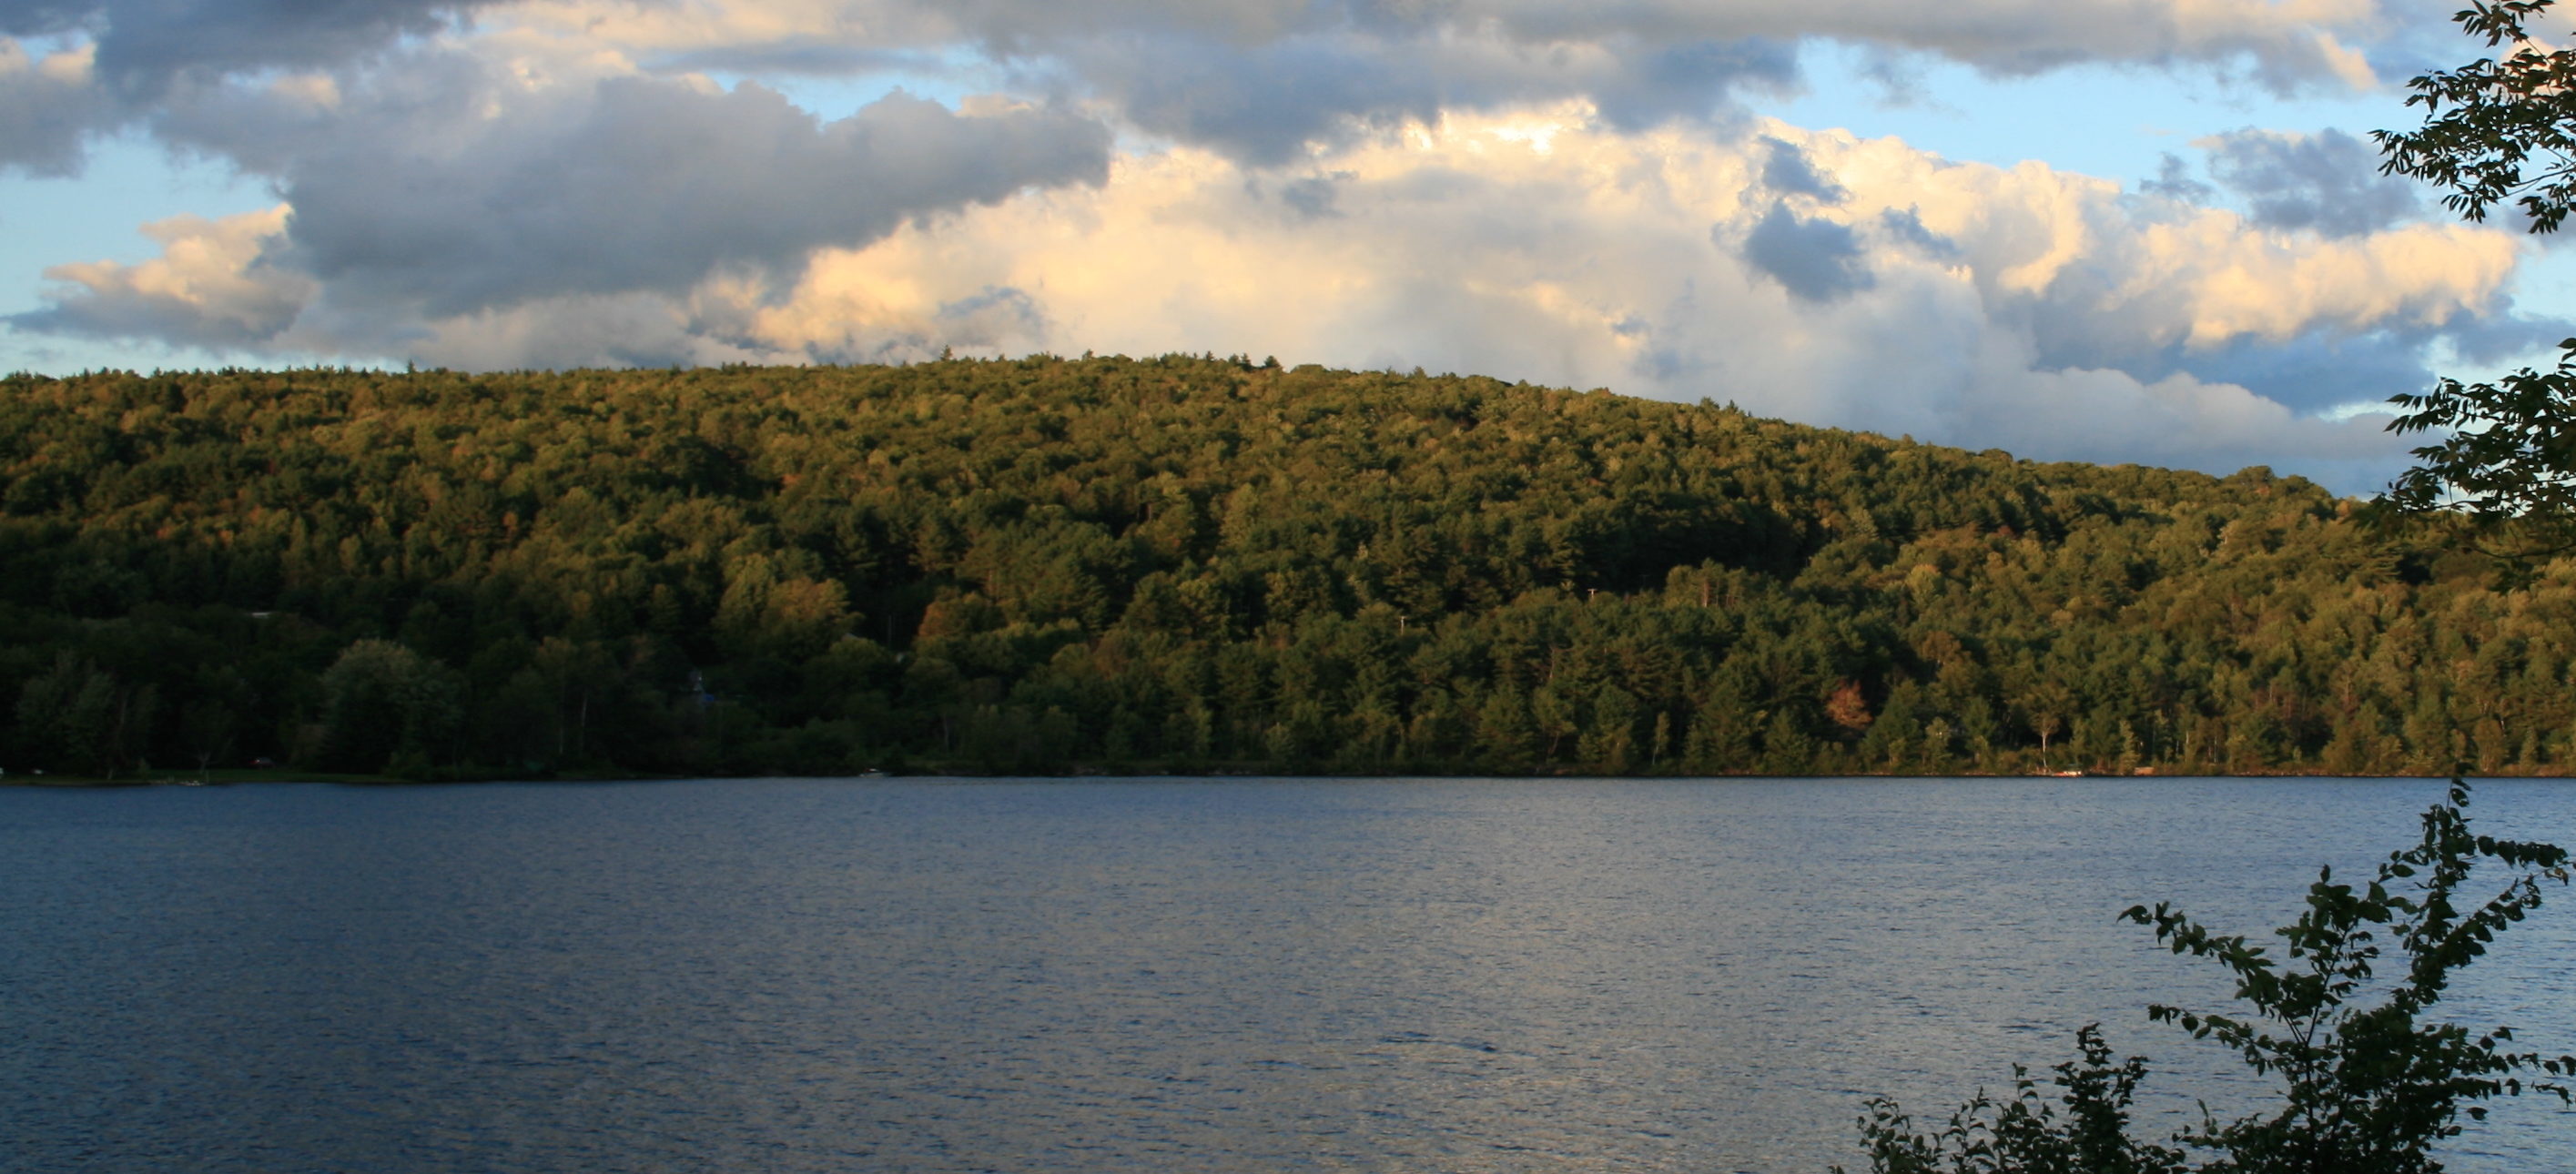
The Mascoma Lake Association takes the responsibility of preserving the quality of Mascoma Lake and surrounding tributaries very seriously. Our goal is to keep our members informed of the issues facing our lake community, and most importantly, to preserve the treasure we have today and protect for future generations.
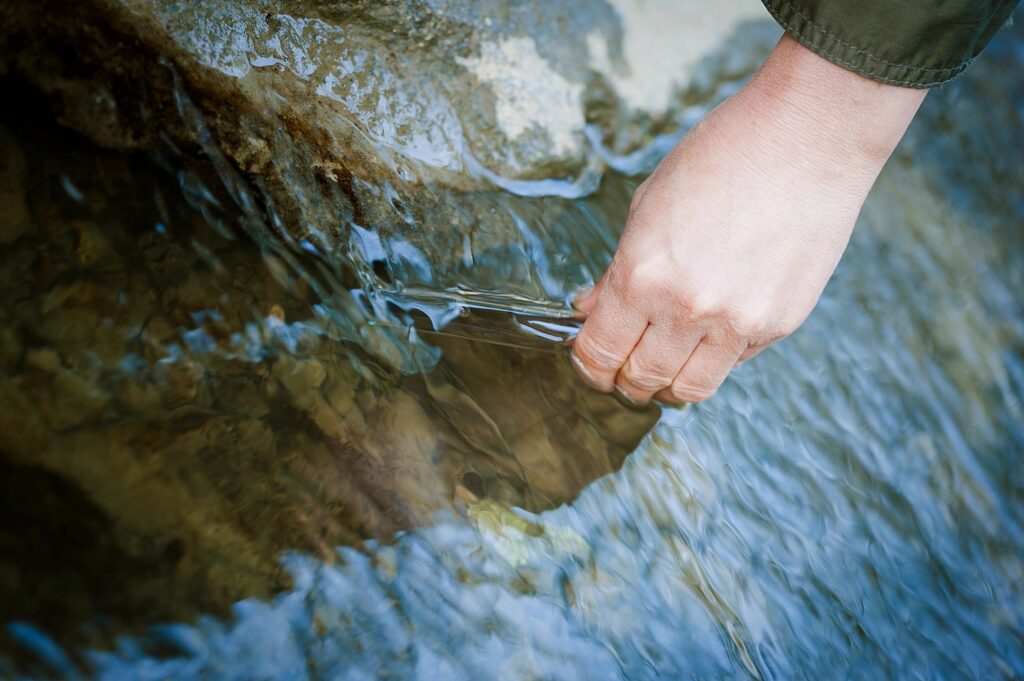
Our Water Quality Committee volunteers take water samples of the lake and/or tributaries following United States Environmental Protection Agendy procedures to ensure quality control. Training and support is provided by New Hampshire Department of Environmental Services. Typically, there are three sampling events per year. Our annual reports, listed below, are packed with information about our lake’s current health and past trends.
The Water Quality Committee is chaired by Jim Martel. Please reach out to us if you have any questions, concerns or ideas on improving water quality at Mascoma Lake.
Some Things YOU Can Do To Improve Lake Water Quality!
- Use cleaning products containing no phosphates.
- Use only zero phosphate fertilizer on your lawn.
- Reduce and/or redirect storm water running off your property. For more info on Stormwater Management click HERE
- Leave the shoreline and nearshore area in its natural state. Conversely, restore altered shorelines to a more natural state.
- Don’t feed the waterfowl.
- Don’t dump sand in the lake.
MLA Annual Water Quality Reports
2025 Water Quality Report
by Mark Manikian
The water quality of lakes is defined by 3 classifications; Oligotrophic, Mesotrophic and Eutrophic. Oligotrophic ecosystems are characterized by low nutrient (nitrates,phosphates & carbon) concentrations which result in clear water with limited plant and algal growth and abundant dissolved oxygen. These lakes are typically deep and cold. Mesotrophic lakes have higher nutrient loads resulting in increased plant and algal growth, lower oxygen levels and lower clarity water. Eutrophic lakes have high nutrient loading, substantial plant and algal growth, and murky water with low oxygen levels.
I am happy to report that Mascoma Lake, after years of being classified mesotrophic, achieved improvement to the oligotrophic category a couple of years ago and continues to maintain that status. Most lakes are mesotrophic and moving up to the higher quality level is atypical. This was accomplished by the construction of the sewer line along Rt 4a and the dedicated commitment of our residents to limit the use of phosphate fertilizers, considerate boating and being mindful of keeping organic debris out of the lake. The recent legislation regarding septic systems on the Rt 4 side of the lake in Enfield should have an additional positive impact on our water quality.
The biggest threat to the health of our lake today is wake boats. The deep and powerful waves generated by these boats stirs up legacy deposits from the bottom and reintroduces them to the water column unless they are in deep water and way offshore. They also erode the shoreline, depositing organic matter into the lake. This is not good by any measure and is only weakly restricted in New Hampshire. Maine and Vermont have passed well thought out regulations which should displace an increased number of their wake boats to our state – especially to the lakes on the border. Again, not good.
The recent cyanobacteria blooms have been disruptive to our summer living but they are not an indicator of the health of our lake. The lake water is tested throughout the summer from the surface to the bottom for many parameters of quality by our VLAP program. Cyanobacteria is a normal inhabitant of all water – both fresh and salt. Overgrowth occurs when conditions such as warmth, reduced flow and contaminated input occur. There were over 100 blooms last year across the state. Considering the fact that many of these lakes are interconnected, we are embarking on a $100K state funded study to evaluate the entire watershed to Mascoma – every river, every tributary – to further protect our lake into the future.
2022 Water Quality Report
By Jim Martel
| Parameter | 7/19/2022 | 7/20/2021 | NH Median | Long Term Trend |
|---|---|---|---|---|
| Secchi Disk, m | 3.10 | 2.6 | 3.3 | Slowly Improving |
| Chlorophyll-a, µg/L | 3.12 | 3.42 | 4.39 | Stable |
| Phosphorus, µg/L Epilimnion (upper) Hypolimnion (lower) | 6.0 10.0 | 10.0 16.0 | 11 14 | Stable |
| Turbidity, NTU Epilimnion (upper) Hypolimnion (lower) | 1.09 1.22 | 0.88 2.64 | 10.0 | No sig. Change |
| PH Epilimnion (upper) Hypolimnion (lower) | 7.4 6.51 | 7.35 6.47 | 6.6 | No sig. Change |
| Acid Neutralizing Capacity, mg/L Epilimnion (upper) | 14.3 | 12.0 | 4.9 | No sig. Change |
| Conductivity, µmhos/cm Epilimnion (upper) Hypolimnion (lower) | 77.0 66.6 | 84.5 72.2 | 42.3 | Slowly Increasing |
* Samples taken from Station 1 Deep Spot.
2020 Water Quality Report
Impacts of the 7/11/2019 Mascoma River upstream wash-out
Data gathered before (6/27/19), right after (7/16/19) and a year later (6/16/20) seperated in columns below by forward slash /
| Location Mascoma Lake | Color | Turbidity | Total Phosphorus |
|---|---|---|---|
| 70 / 170 / 50 | 0.73 / 11.6 / 0.74 | 12.4 / 24.0 / 10.0 | |
| 2m deep | – – – | 0.64 / 3.4 / 0.8 | 8.6 / 18.0 / 7.0 |
| 9m deep | – – – | 0.73 / 3.5 / 1.7 | 12.4 / 14.0 / 12.0 |
| Mascoma River Inlet | – – – | 1.98 / 3.5 / 2.73 | 12.6 / 18.0 / 15.00 |
| Secchi Disk = 2.75m = 9ft / 1.0m =3ft / 3.5m = 11.5ft | |||
Water Quality Terms:
COLOR (Water Clarity): Clear 0-25 / Light Tea-Color 25-40 / Tea Color 40-75
Turbidity is a measure of the cloudiness or lack of clarity of water, caused by the scattering or absorption of light by sediment, algae, or other particulates suspended in water. Chronic and high levels of turbidity can impair designated uses such as aquatic life and primary recreation (swimming). Turbidity is measured in Nephelometric Turbidity Units (NTU).
Phosphorus – is an essential element for plant life, but when there is too much of it in water, it can speed up eutrophication (a reduction in dissolved oxygen in water bodies caused by an increase of mineral and organic nutrients) of rivers and lakes. Soil erosion is a major contributor of phosphorus to streams. Bank erosion occurring during floods can transport a lot of phosphorous from the river banks and adjacent land into a stream, lake, or other water body.
Secchi disk – an 8-inch diameter disk with alternating black and white quadrants that is lowered into the water column until it can no longer be seen from the surface. The point at which the disk disappears is a function of the lake turbidity.